
It’s been two years since my last post about why I believe triathlon training is better with technology. This particular post received many views, was directly linked by at least one other site, and prompted many conversations with friends and teammates. Looking back, I’ve made some significant modifications to the technology I use, how I use it, and why I think collecting data from our “smart” devices is a huge benefit to athletes. This is an update to my prior post. Read on for more.
What Data Do You Want?
Over the last two years I started thinking about the types of data I wanted to collect, why I wanted to collect it, how I wanted to collect it, and started piecing together the analysis I could perform once I had the data. Let’s jump right in to my high-level overview of the technology I use and then we’ll get into what I do with it and why.

My primary goal was to automate the data collection. Every day I was manually logging my weight and occasionally my sleep. As a result, I took a step back and started thinking about the data I wanted. Here’s a list of what I wanted to capture:
- Weight
- Body fat %
- Hydration level
- Sleep (hours and quality)
- Workout details (swim, bike, run, & other)
- Steps
- Heart Rate Variability (HRV)
- TSS
- Form/Fitness
- “Best” efforts (swim, bike, run)
- Calories (only tracked occasionally)
My Devices & Things
Over the past two years I started to gradually acquire devices that would capture the data automatically. Let’s break down some specific devices and things and see what they do for me. After we talk about the devices, we’ll look into the software tools and what you can do with the data we are collecting.
Withings Body Scale: Pretty simple. Step on it and it logs your weight, body fat %, and water composition. It uploads all this to the cloud. I have it synching to all of the tools I use to analyze my workouts. Some use this to automatically calculate data such as watts per kilogram. Note: In order to get this to sync weight to Garmin Connect, I must connect the scale to MyFitnessPal and connect MyFitnessPal to Garmin Connect. It’s a minor annoyance, but works after initial setup.
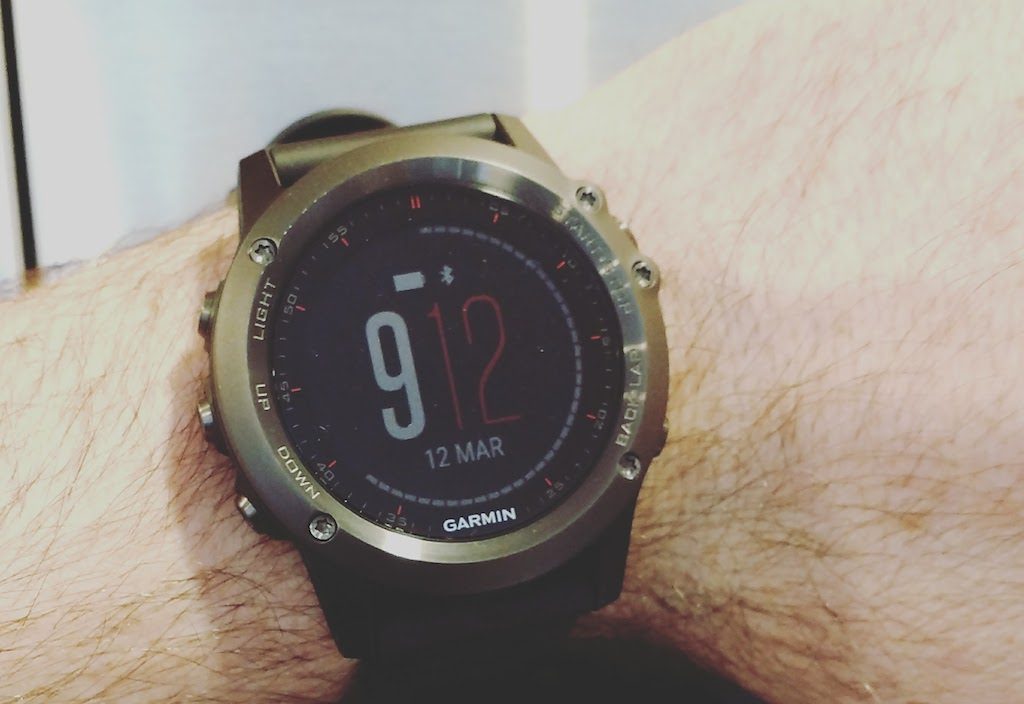
Garmin Fenix 3: As I’ve mentioned in my training and racing on a budget post, I purchase devices that are 1-2 years old and which are refurbished. It’s a great way to get good technology cheap. I use the Fenix 3 to track my swims, runs, triathlons, and other activities such as skiing and walking.
Garmin Edge 800: This is an old device, but I use it on my bike rides. It has navigation capability so I can load routes when I head out side and make sure I don’t get lost.
Garmin Vivofit: I still wear the first generation Vivofit. It is set as my primary activity tracker and automatically tracks my steps and sleep. While my Fenix 3 can do all this, I prefer to sleep with a slimmer device and continue tracking steps when I wear a dress watch for work.
SleepIQ: I have a Sleep Number bed. It’s the best bed I’ve ever owned. In fact, I’d recommend it to ANYONE. If you decide to get one, tell them I sent you. But, my bed has some cool tech inside of it. My bed tracks my sleep much like my Vivofit. More on what this can do below.
Nest Thermostat: Pretty self explanatory…keeps my home at the temperature I set. But it integrates with some software nicely.
HRV4Training: Technically this is an app that runs on your smart phone. I am using this to capture my heart rate variability. I’m new to the game, but I’m mostly after tracking both my HRV over time and resting heart rate.
Software Linking the Devices to Desired Data
Ok, so we’ve got all the devices collecting data and we know what data we care about. Let’s link it all together by starting with the largest component of the integration setup.
Garmin Connect
Garmin Connect is both an excellent free piece of software as well as the bane of my existence. As I have three Garmin devices, I’m essentially required to push all the data it collects through Garmin Connect. There are some exceptions to that rule, but by and large, Garmin is the gatekeeper for the data on my Fenix 3, Vivofit, and Edge 800. In my case, Garmin pushes information into Strava, TrainingPeaks, Golden Cheetah, Google Fit, and MyFitnessPal/MapMyFitness. As you’ll see below, I’ve pretty much moved on from using Garmin Connect as my primary analysis tool. That’s not to say that you can’t do it, but for someone who likes to see their data as much as I do, it has significant limitations. Further Garmin keeps a lot of its data within its walls and doesn’t share it with others. Also unlike many other companies, a developer must pay $5,000 to get access to Garmin’s API. For me, I mostly use Garmin Connect to link all my other services together.

TrainingPeaks
Despite me claiming I saw no benefit to paying for TrainingPeaks in the past, I’m a convert. First off, any member of USA Triathlon can get a discount if you search for it. Keep in mind it’s well hidden. Second, as I use TrainerRoad for all my training plan needs, I create a workout in TrainingPeak’s library for each of my workouts. I even have recently used the workout builder to make sure I get a clear TSS picture of my week and know what my workouts are going to look like. TrainingPeaks is the largest piece of my day to day training.

I use the performance management chart to keep my finger on the pulse of my training. If I travel a lot, take a boatload of time off, it is extremely easy to see in the chart. The other nice piece is since I build all my workouts and schedule them, I can see future performance impact.

TrainingPeaks also allows for many metrics to be loaded in. As you can see below, I have weight, body fat %, sleep, and HRV and resting heart rate all in an easy to use chart. While I’m new to the HRV party, I’m already seeing trends where travel for work can take 2-3 days to fully recover despite having “off” days. TrainingPeaks also has nifty “best” charts to compare your efforts over given durations or distances to another time period.

Also, since my weight is updated daily and sent to TrainingPeaks, it calculates my watts per kilogram against every ride I perform. While I’ve found Golden Cheetah a bit cooler for what I can do with it, this is another “finger on the pulse” chart. Put more simply, am I producing more watts per kilogram over a period of time? Did that fit change have an effect? It is quite powerful.

SleepIQ
As I mentioned above, I primarily use my Garmin Vivofit to track my sleep. I log this every day in TrainingPeaks manually as I’ve had significant issues with automated third-party tools. That said, SleepIQ performs a similar task as my Vivofit with two little tricks up its sleeve. With a recent software update, SleepIQ now integrates with both Nest Thermostats and MyFitnessPal/MapMyFitness. Why is this important? These two integrations have helped me answer two important questions. The first is “at which temperature do I sleep best?” After many nights, the answer is 66-67 degrees. The second question is “what, if any impact does working out at night have on sleep quality?” After many nights and evening workouts, I have determined that for any workout I complete within 90-120 minutes before bed, I sleep worse mostly because it takes me a while to get to sleep.

Because of these two answers, I’ve been able to make sure I keep my bedroom as close to the “ideal” temperature as possible and start getting in longer workouts in the morning and saving shorter ones for the evening.
TrainerRoad
I’ve spoken about and written about TrainerRoad many, many times. TrainerRoad is by FAR the best value out there for a triathlete or cyclist. For just a few dollars a month, you get access to a library of excellent workouts AND training plans. For a triathlete there are options ranging from sprint distance up to full Ironman. Within each training plan there are low, mid, and high volume options with each a base, build, and specialty phase of training. The app and website is cross platform and easy to use.

As I mentioned above in the TrainingPeaks section, I deliberately map out my season by creating every TrainerRoad workout and dropping it onto my calendar. It is manual and initially painful, but now I have a great library of workouts and can see what is coming up every day.
Strava
I used to be one of the largest Strava fan boys. Unfortunately, I’ve found Strava really hasn’t done much for my “training” other than showing me what my friends and teammates are up to. Strava has turned into the Facebook for athletes. Don’t get me wrong, it’s great to see what others are doing, compare yourself to them, and give the virtual high five. But the tools are just not there. I’ve found various issues over the course of the years as specifically related to triathlon training. Even the most basic things such as tracking a 25 yard pool lap or combining a multisport activity still are not in the product.
The best feature of Strava is the segments. You create a segment using GPS and overlay it on a map. You can then compare your efforts to your peers and others from then on as well as track your own efforts to see if you are improving. I use this to track at a high level if I can ride that hill faster or push the flats at a higher rate of speed.

Golden Cheetah
Golden Cheetah is a desktop software application that runs on Windows, Mac, and Linux. It was created by a team of developers with the basic idea that the data your devices produce should be yours. You should also be able to draw trends, use the latest in sports science research, and not rely on any proprietary formula to become a better athlete. This application is a monster with what it can do. It can combine virtually every other application I use into one. It suffers from one major flaw and that is complexity. Golden Cheetah is tough to setup but once complete, it is a great training tool. This app tracks my weight, body fat %, all my workouts, changes in FTP, “best efforts”, and training load. It is usually the final app I use to review my performance and trends.
Golden Cheetah provides ultimate flexibility in your views, calculations, and even allows you to create custom metrics.


In the view below, I was able to setup a customized dashboard that gives me a list of the top 10 efforts in each time duration for each triathlon discipline I care about. You’d hope to see new entrants to this list as your season goes on. Seasons are another awesome feature of Golden Cheetah. You can enter your major races or events and it will plot them on all the reports so you can see how your performance peaked for them.

I like to see how specific running and swimming metrics are progressing as the season goes on. It is relatively easy to set these up.


One great feature is the ability to download user contributed reports. One such report is a triathlon running split predictor. It uses the VDOT calculation and then modifies it a bit for triathlon. In last year’s Ironman Timberman 70.3, it predicted my run split within 3 minutes. As you can see, depending on how your runs are going currently, the calculation is constantly moving.

The beauty of Golden Cheetah is you can overlay metrics which are seemingly unrelated to tell an interesting picture. The below chart is my weight and body fat % overlaid on my watts per kilogram. This is quite a telling picture showing the improvement in the watt/kilo calculation either due to weight loss, or general fitness improvement.

In Summary
It’s important to understand that while I love the data my devices and things produce, the software tools, and the analysis of the data, I’m not a slave to my device. Some days I just feel like garbage on a run or ride. I’ll do what I can do knowing I’m not hitting my marks. I work for a living and know that I miss workouts due to travel or just life. But what I think is most interesting about the tools available to us is that we can use them to help us become better athletes. As I noted above, these tools have helped me understand the best way to get sleep, show me recovery time from work travel, and help me get a better picture on if I’m improving. Some tools even help you determine at what paces or efforts you should hold to complete your desired race.
It is an exciting time we live in and really do believe triathlon training is better with technology. But as I mentioned, I caution you by living and breathing by your devices. They are tools and should be used as such. I hope you’ve found this helpful for your own training. Drop me a line if you have any questions or comments.