
2017 Update: Read here.
Seven Weeks to First Race
I can’t believe it, but time is flying by. There are only seven weeks until my first triathlon of the year (King Pine). Since then my training has ramped up. I’m loosely following the plan here. I’m feeling good, dialing in the fit on the bike, and working on running and swimming mechanics. It’s clearly working as I’m getting faster in all disciplines. I could do without the surprises of snow, though. This little gem came this week.

Using Technology to Track Progress
It’s no secret that I love technology. Between all the devices I have on my wrists or bike, they each serve a purpose to track different amounts and types of data. The data is then generally fed into Garmin Connect or Strava for analysis. I thought it would be interesting to share how I use the technology at my disposal to help plan, execute, and analyze workouts. Read on for more.
Planning Triathlon Workouts
Unless you want to use and pay for a service like Training Peaks, I find neither Strava nor Garmin Connect are “perfect” for planning future workouts. As of this writing, Strava flat out doesn’t allow you to plan future workouts. Garmin Connect is pretty good at allowing you to plan workouts, but you must first create them in their workout builder. Run and Bike workouts are supported out of the box, but to plan a swim you need to utilize the “Other” category or use a note.
Building a workout is easy. Simply add blocks for warmup, repeats with recovery, and a cooldown. After the workout is created, you can either use it as a reference or go one step more and load it onto your device.

In order to insert a workout into your calendar for your plan, simply click on the date in your calendar, select workout, and then drag and drop it onto your day.

If you use a calendar service such as Google Calendar, you can get a feed of the workouts you’ve scheduled and get a calendar URL. Simply click the arrow looking thing in the top right of the calendar and select “publish calendar”. This will provide a link you can import into your calendar program.

Analyzing the Data
Of course you can use the activity screen to view and analyze your workout. I like to see where my heart rate, pace, cadence, or power (if applicable) were during a given point in a workout.

I’ve found Garmin Connect offers a fantastic set of tools if you just take some time to set them up. I created a five tab set of dashboards. The first is the “Activities” dashboard. This shows me my latest activity, monthly calendar, weekly calendar (planned and completed workouts), and a feed of my connections.

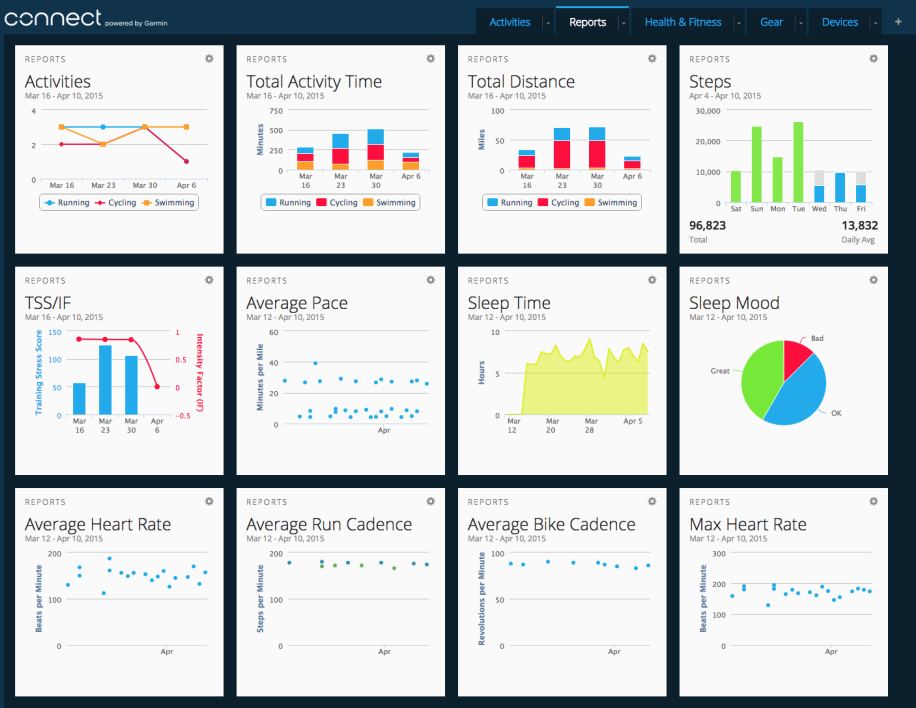
My Second dashboard is “Reports”. This is my favorite and most useful dashboard. This gives me an overview of every set of data that I care about to trend over a 4 week period. Working left to right and top to bottom these are:
Activities
This shows the activity count for each running, biking, and swimming. If I add something like a snowshoe it will show up as “other”.
Total Activity Time
I like to track my total activity time and see it broken out by each triathlon discipline. From a time standpoint, this helps me determine if my ratios are in line for each discipline. As you can see below, my total bike and run times are almost split evenly over the last few weeks. Clearly I need more bike time.
Total Distance
Similar to total activity time, this shows the mileage breakdown of each triathlon discipline.
Steps
I purchased a used Vivofit with the intention of primarily tracking sleep, but it also counts steps. Aside from comparison to my connections, not much use here.
TSS/IF
TSS and IF are metrics that help you determine training load on your bike. I’ve noticed that this seems to only work if you use a Garmin device and upload the activity to Garmin. I’ve done a few Zwift workouts and uploaded that file. TSS/IF were not calculated.
Average Pace
Average pace is a bit tricky as each triathlon discipline shows up on here. The fastest average pace (closest to bottom) is cycling. Above that is running. And way at the top is swimming. I like to see how my average speeds are changing or staying the same. Four weeks isn’t a lot of time to see change, but you can notice slight speed increases.
Sleep Time
I’ve been using the sleep time graph to start determining how I feel based on several factors. For example, do I feel better with 6, 6.5, 7, 7.5, or 8 hours of sleep? Do I feel just as good with 7 hours sleep if I do a workout at 8 pm? This data is starting to open some interesting trends on how I’ll feel in the morning.
Sleep Mood
Somewhat subjective, but “how I feel” in the morning is a simple checkbox. Do I feel great, ok, or bad?
Average Heart Rate, Run & Bike Cadence, Max Heart Rate
Grouping these together are showing me how the body is reacting. For example, I see great comfort in the fact average heart rates are coming down (along with max heart rates) while average paces are also declining. Basically, I’m able to do more with less. The cadence trending ensures I’m staying efficient on the runs and bikes. For both disciplines I’m targeting cadences of 90+.

How was Today?
The next dashboard is used to show me a bit more about “today”. I see my step count, weight trend, and a more detailed graph on last night’s sleep. I, like many others, wish the sleep graph was a bit more sophisticated. It tracks movement, but doesn’t rate the quality of your sleep, how many times you woke up, how restless you were, etc.

Track your Stuff
As triathletes, we go through lots of equipment. Shoes last only around 400 miles and bike tires last roughly 1,000-3,000 miles depending on the brand. I like being able to get a notification on when my shoes might need replacing. It’s also interesting to track total mileage on your bikes to determine when you might need tire replacements.

Where’s Strava?
Ah, Strava. Strava was my go-to…right until I started triathlon training. I find that as I’m heavily invested in the Garmin ecosystem, Garmin Connect works very, very well. Strava does ok, but really doesn’t work well enough for most analysis. For example, Garmin has full swim analysis. Strava, winds up combining laps (such as 25 yard repeats) and calls them 50 yard laps. Not cool.
Strava does do a great job of motivating you on segments and recently rolled out a change resetting the PR leaderboards each year. While Garmin does have a concept of segments, it doesn’t work nearly as well as Strava and doesn’t have as many segments.

It’s also fun to use Strava to get a super high overview of training time and distance this year compared to last. Notice anything interesting?

